The following calculations are used to communicate to end users the accuracy of a qualitative test method. Qualitative test methods are those that give a positive or negative diagnosis, regardless of whether the assay produces results with numerical values.
Definitions of Performance Characteristics
KEY
TP = True Positive
FP = False Positive
TN = True Negative
FN = False Negative
Diagnostic Sensitivity
Percentage of positive samples correctly identified in an experiment with known positive controls; used to assess risk of false negative results.
TP / (TP + FN)
Diagnostic Specificity
Percentage of negative samples correctly identified in an experiment with known negative controls; used to assess risk of false positive results.
TN / (TN + FP)
Global Accuracy
Percentage of all correct diagnoses in an experiment; accounts for both false positive and false negative results
(TP + TN) / (TP + TN + FP + FN)
Calculating Performance Characteristics of a Single Test
Data Input
Total number of samples in experiment = ____ (number entered would be used to generate rows in table below)
Calculator Coming Soon!
Reporting and Interpreting Results
Results are reported as percentages. A percentage greater than 50% indicates that the test is a better predictor of sample diagnosis than random chance.
Where possible, it is recommended to design a validation experiment to include the test method under study and a standard method. In this way the accuracy values can be compared between tests to describe how they differ. These differences can be used to inform their intended use and/or place in a larger diagnostic protocol.
Example:
- Test method A has a Diagnostic Sensitivity of 85% and a Diagnostic Specificity of 95%.
- Test method B has Diagnostic Sensitivity of 95% and a Diagnostic Specificity of 85%.
Test B is less specific (greater risk false positive) but more sensitive (low risk false negative) compared to Test A.
Test B could be used as a screening tool and Test A used as the confirmatory method in a diagnostic protocol.
Comparing Performance Characteristics of Multiple Tests
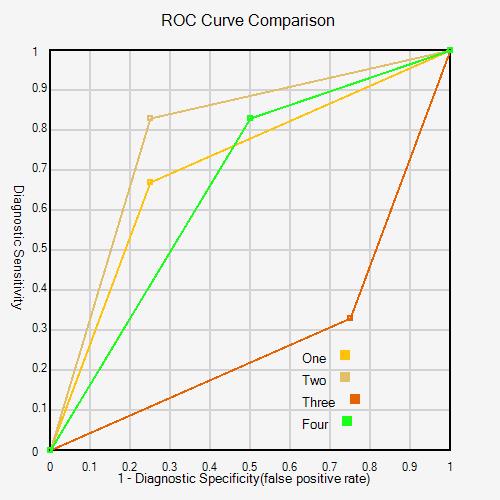
The diagnostic sensitivities and specificities of two tests can be compared graphically using
Receiving Operator Characteristic (ROC) curves. A ROC curve plots diagnostic sensitivity by the false positive rate (1 – diagnostic specificity).
- A curve that is shifted right has a higher false positive rate.
- A curve with a lower maximum amplitude is less sensitive.
- A curve that is a diagonal line would represent a test whose accuracy is the same as random chance.
The
area under the ROC Curve (AUROCC or concordance statistic) also informs a user about a test’s accuracy. The AUROCC value gives an estimation of the likelihood that a test method will give a correct diagnosis.
- If the AUROCC is 1, the test is a perfect predictive tool of infected status.
- If the AUROCC is 0.5 or less, the test has no predictive power.
Comparing Accuracy of Multiple Tests - ROC and AUROCC Calculator
Calculator Coming Soon!