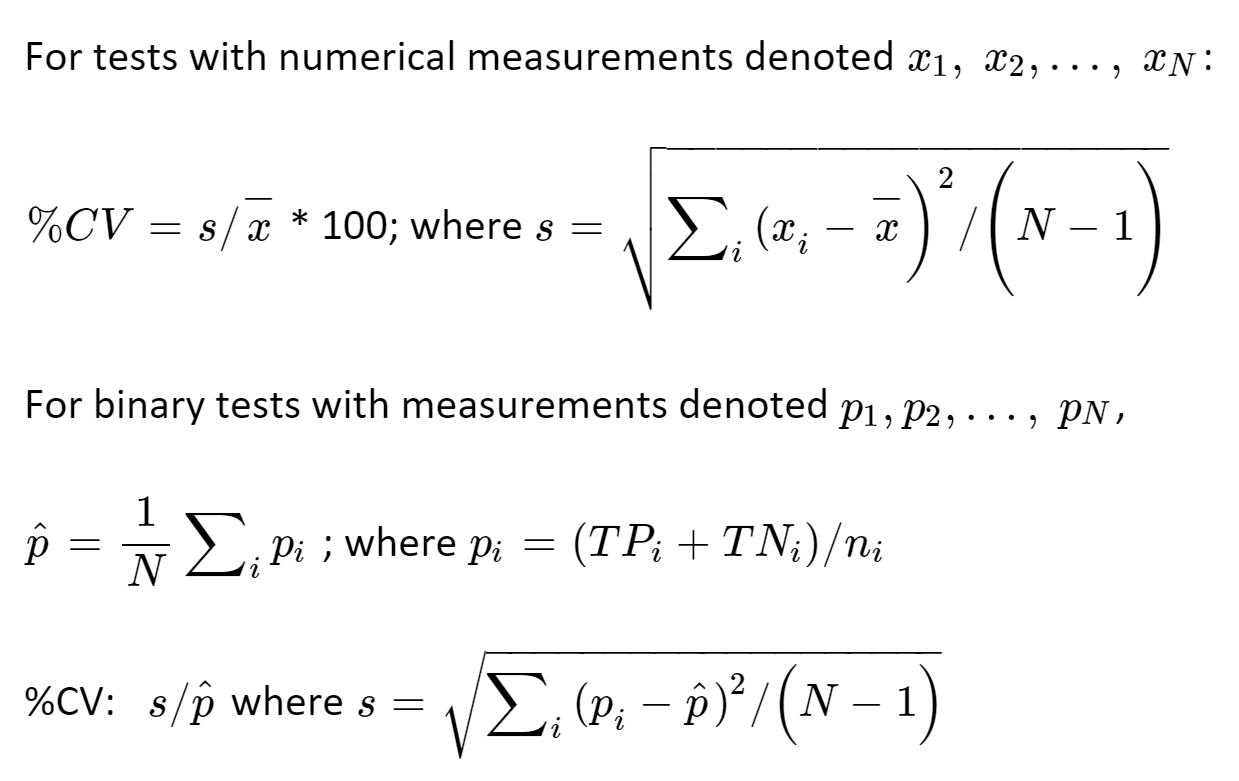
The following calculations are used to communicate to end users the precision of a qualitative test method. Qualitative test methods are those that give a positive or negative diagnosis, regardless of whether the assay produces results with numerical values. The methodology used to calculate precision differs depending on whether the test method produces binary data (presence/absence) or numerical results (Ct values, OD values, etc). In either case, the precision performance characteristic can be expressed in terms of a standard deviation.
Definitions of Performance Characteristics
KEY
CV = Coefficient of Variation (Also known as Relative Standard Deviation)
s = standard deviation
x̄ = average of
xi's
xi = ith numeric test result
ni = number of binary results for replicate i
TPi = # of True Positives among ni binary results
TPi = # of True Negatives among ni binary results
pi = proportion of correct results for the ith replicate
N = total number of measurements
CI = Confidence Interval
Repeatability
Consistency in results between technical replicates from a single experiment
Intermediate Precision
Consistency in results between experiments when more than one variable is added. Variables could include multiple operators, instruments, days, and/or any one other factor.
Reproducibility
Consistency in results across laboratories where multiple variables can be assessed.
The calculations used for all three precision characteristics are the same (see below). The difference lies in the experimental design and resulting data used as input. A measurement, such as the average, percent coefficient of variation, or percent of correct determinations (binary), is evaluated by its range of error.

Calculating Repeatability
Data Input - Numerical Data
Total number of samples tested = ____ (used to generate table)
Repeatability Calculator for Numerical Data
Data Input - Binary Data
Total number of samples tested = ____ (used to generate table)
Total number of replicates per sample = ___ (used to generate table)
Calculating Intermediate Precision and Reproducibility
Data Input - Numerical Data
Total number of samples tested = ____ (used to generate table)
Total number of conditions (analysts and instruments) = ___(used to generate table)
Precision Calculator for Numerical Data
Data Input – Binary Data
Total number of samples tested = ___ (used to generate table)
Total number of replicates per sample = __ (used to generate table)
Total number of operators or instruments = __ (used to generate table)
Total number of labs = __ (used to generate table)
Precision Calculator for Binary Data
Reporting and Interpreting Results
For tests that produce a numerical value, such as a Ct value or OD value, the precision may be reported as both a CV percentage and the associated error (µ +/- CI at α = 0.05)
Example:
The test had a repeatability CV of 2.3% (21.5 +/- 0.31 at α = 0.05, n=5). Intermediate precision with 3 operators was determined to be 2.8% (21.5 +/- 0.30 at α = 0.05, n=10). Reproducibility CV between the 5 laboratories was 4.5% (21.7 +/- 0.27 at α = 0.05, n=20).
For tests that produce a binary result, such as a positive or negative diagnosis, the precision is reported as the precision estimate and the associated error (p̂ +/- CI)
Example:
The test had a repeatability estimate of 80% +/- 9%, n=5. Intermediate precision with 2 operators was 87% +/- 11%, n=10. Reproducibility p̂ between the 3 laboratories was 86% +/- 7%, n=20.
Where possible, it is recommended to design a validation experiment to include the candidate test method and a “gold" standard or reference method. Some validation studies are structured to compare tests to observe improvements. Others compare tests to confirm equivalence or comparability. Comparisons inform analysts on the suitability of a test for broader use.
Example, improved measurements:
- Test method A has a repeatability mean of 0.06 +/- 0.01 OD, n=20, and reproducibility mean of 0.09 +/- 0.02 OD, n=50.
- Test method B has a repeatability mean of 0.17 +/- 0.02 OD, n=20, and reproducibility mean of 0.18 +/- 0.04 OD, n=20.
Interpretation: Test method A is statistically different to test method B. This is desirable if test A is an improvement from test B.
Example, comparable measurements:
- Test method A has a repeatability standard deviation of 0.13 +/- 0.05 OD, n=20, and reproducibility standard deviation of 0.14 +/- 0.06 OD, n=50.
- Test method B has a repeatability standard deviation of 0.12 +/- 0.02 OD, n=20, and reproducibility standard deviation of 0.18 +/- 0.04 OD, n=20.
Interpretation: Test method A is statistically comparable to test method B. This is desirable when:
- Introducing a process improvement (e.g., faster or less expensive) that does not change the outcome of a test measurement.
- There is demand for different test format options, and the options must produce similar measurement outcomes.
- Test A and test B are the same test, but test A was designed in a different lab and test B is being verified to produce similar measurements between labs.
