|

|
|
Plant disease epidemics on agricultural crops impact U.S. agriculture each year by affecting the economic value, quantity, and quality of food and fiber products (20). Losses to fungal diseases alone in North Carolina are estimated at more than $1.1 billion (23). Production costs increase when commercial fungicides and other management measures are used to protect production and stabilize the food supply. Each type of disease pathogen, and the epidemic that results, is characterized by its own unique biology and spatial and temporal dynamics (1,3). Fungal diseases in particular are greatly mediated by weather conditions and climatic patterns. Plant pathologists have cooperated with meteorological scientists to analyze and relate weather to epidemic development in order to reduce the economic impact and environmental effects of airborne plant disease epidemics. Commercial farmers, as well as home gardeners, can use this information to make timely decisions about the effective and economical application of fungicides and about other tactics to manage plant diseases.
The North American Plant Disease Forecast Center (NAPDFC) located at North Carolina State University in Raleigh, NC, provides continent-wide Internet forecasting support to tobacco and cucurbit growers by tracking the geographic presence and future spread of downy mildew pathogens. The two classical diseases forecasted are Tobacco Blue Mold (25) and Cucurbit Downy Mildew (32). During cool, wet, and cloudy weather, both pathogens increase over time by producing large numbers of microscopic, asexual propagules called sporangiospores (conidia) which can be aerially transported both locally and long-distance via atmospheric wind currents in the atmospheric boundary layer (ABL) (34). Using the principles and modern methods of related sciences such as "aerobiology" and "biometeorology," the spatial and temporal pathways these spores travel in the ABL can be forecasted and the future temporal and spatial spread of the epidemics can be predicted. Biological and environmental factors, are used to assess and report the risk level for new, distant outbreaks. The principle differences between the NAPDFC forecasting system and previous local forecasting systems is twofold: (1) aerial transport of spores inciting new outbreaks are involved, and (2) the system addresses spore transport and weather on a macroscale involving the entire North American continent.
Downy Mildew Pathogens Forecasted
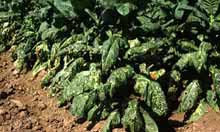
Fig. 1. Field tobacco in Mexico showing leaf damage caused by the blue mold pathogen, P. tabacina. (click image for larger view). |
|
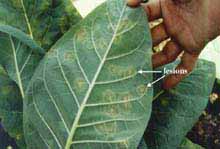
Fig. 2. Downy mildew or blue mold of tobacco, showing sporulation on the bottom of a tobacco leaf (click image for larger view). |
Blue mold of tobacco, also known as 'mildiou du tabac' in Europe(16,18,21,31,33), caused by Peronospora tabacina Adam, is a classical compound-interest plant disease that develops local as well as macroscale epidemics (4,11) (Fig. 1). The fungus is highly weather-sensitive. During periods of cool, wet, and overcast weather the disease can develop in greenhouses and/or fields and spread rapidly because of the polycyclic nature of the fungal pathogen (2,16,17). The rate of continental spread is largely determined by the potential for high levels of initial source inoculum (Fig. 2), short latent period, effective wind dispersal of spores and approximately 500,000 acres of susceptible tobacco fields across the eastern half of the United States and Canada. When the weather becomes clear, dry, and hot, the epidemic usually slows considerably or stops completely.
Commercial tobacco is a seasonal crop in the temperate, humid farming zones of the Southeastern and Eastern United States, Canada, and tropical countries bordering the Caribbean basin. Following a crop-free period (winter) each year in the U.S., tobacco is exposed to asexual, windborne sporanagiospores (Fig. 3) that are believed to originate from inoculum sources of commercial winter tobacco in the tropical production zones south of the 30th parallel of latitude (22,26) and wild Nicotiana species (17,28) in the southwestern United States. It is unlikely that the fungus overwinters in the more temperate zones north of the 30th latitude because oospores have not been found in the U.S. Inoculum is therefore believed to be introduced into the U.S. anew each year (11) (Fig. 4). Further research is needed to clearly elucidate the possible role of oospores in blue mold epidemics.
|
 |
|
 |
|
|
Fig. 3. Sporangiophore (stalk) of P. tabacina on bottom surface of tobacco leaf with sporangiospores (conidia) attached (click image for larger image without labels). |
|
Fig. 4. Severe case of blue mold infection in greenhouse transplant production. Every plant in greenhouse systematically infected. All these plants should be destroyed (Click image for larger view). |
|
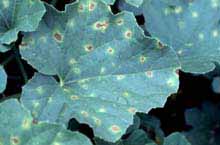
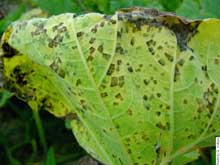
Downy mildew of cucurbits is caused by Pseudoperonospora cubensis (Berk. & M.A. Curtis) Rostovzev. Symptoms of the disease differ considerably both between and within cucurbit species. Lesion margins are irregular on most cucurbits (Fig. 5a), but on cucumber and squashes they are angular and bound by leaf veins (Fig. 5b). Sporulation occurs on the underside of leaves, and as lesions expand, they often coalesce, resulting in the necrosis of progressively larger leaf areas. In a few days the entire leaf is dead.
 |
|
 |
|
Fig. 5a. Downy mildew in cantaloupe caused by P. cubensis showing necrotic spots with irregular, chlorotic margins (click image for larger view). |
|
Fig. 5b. Downy mildew on the underside of a butternut squash leaf caused by P. cubensis showing gray-purple, downy sporulation delimited by leaf veins (click image for larger view). |
|
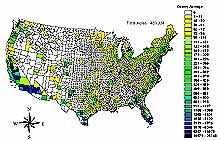
Fig. 5c. Total harvested acres of all cucurbits in the U.S. in 1997 by county. Source: 1997 USDA-NASS Agricultural Census. Graphic produced by G. Holmes using ArcView (click image for larger views). |
|
There are several differences between the life cycles of the tobacco blue mold and cucurbit downy mildew pathogens. For example, the asexual reproductive structures of Pseudoperonospora spp. are sporangia which release zoospores; sporangia in Peronospora spp. germinate directly and are often referred to as “conidia.” Also, physiological specialization exists in P. cubensis and five pathotypes have been described (Table 1). Cucumber and netted melon cultivars are sometimes heavily infected, while nearby watermelon, squash, or pumpkin are not. Moreover, cucurbit crops are distributed more widely in the U.S. than tobacco (Fig. 5c).
Despite these differences, epidemics caused by cucurbit downy mildew resemble epidemics caused by tobacco blue mold in many respects. The pathogens are closely related in their biology and the way they interact with their hosts. Most important is the lack of clear evidence to suggest that oospores of either pathogen are involved in overwintering in the United States. Therefore, inoculum of both pathogens is thought to be introduced anew each year. Long-distance transport of infectious propagules probably occurs via the same mechanisms, and thus disease forecasts of this type can be made in the same manner (13,14).
Table 1. Interactions of cucurbit hosts with pathotypes of Pseudoperonospora cubensis
| Host |
Pathotype |
| 1 |
2 |
3 |
4 |
5 |
| Cucumis sativus (cucumber) |
+ |
+ |
+ |
+ |
+ |
| C. melo var. reticulatus (cantaloupe) |
+ |
+ |
+ |
+ |
+ |
| C. melo var. conomon (pickling melon) |
– |
+ |
+ |
+ |
+ |
| C. melo var. acidulus (sour melon) |
– |
– |
+ |
+ |
+ |
| Citrullus lanatus (watermelon) |
– |
– |
– |
+ |
+ |
| Cucurbita spp. (pumpkin, squash, etc.) |
– |
– |
– |
– |
+ |
+ = highly compatible host-pathogen interaction.
– = Incompatible or very slightly compatible host-pathogen interaction.
Reporting Network
Research on the epidemiology and biometeorology of tobacco blue mold at N.C. State University began in 1981 following severe continent-wide epidemics in 1979 and 1980 (6,9,19). Moss and Main (27) demonstrated that a new high-temperature biotype of P. tabacina caused an early spring plant bed disease to develop into a serious summer production problem. The blue mold forecasting system was made available to all growers and the industry in 1995 (24). In 1998, a similar forecasting system for downy mildew of cucurbits was developed. Macroscale epidemics of blue mold have occurred each year since 1979 (5). The impact of these two pathogens each year largely depends upon the time of inoculum arrival and frequency of favorable weather conditions on the North American continent.
The forecasting system is dependent on timely and well-documented disease reports. Growers report suspected cases of the mildew diseases to their county agents. State extension specialists and industry scientists (designated as Coordinators), located in tobacco and cucurbit producing states, confirm and report new and/or important continuing disease sources directly to the NAPDFC. Reports are posted daily or as often as necessary. A web-based disease Report Form is incorporated directly into the forecast homepage requesting the geographic location of the source(s) (the nearest town or other landmark) and observed source description and characteristics. Multiple source sites located close together (for example, within the same county) are often combined and represented by a single, central location. State coordinators prioritize the relative importance of the various disease locations, which assists the NAPDFC forecaster in focusing time and effort on the highest threat disease situations. If a source ceases to exist because of good fungicide control, changes in weather, or destruction of the crop, this information is also requested. The NAPDFC uses the recent and important continuing source sites to post a set of updated reports of occurrence of disease and forecasts each day. Internet forecasts are typically completed in the afternoon (after 6 p.m.) of the reporting day following detailed analyses of local and national weather data. If serious or urgent situations present themselves, forecasts are issued on additional days.
Forecast Model
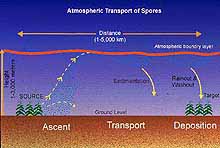
Fig. 6. Diagram showing major components of atmospheric transport of biota (click image for larger view). |
|
As the confirmed disease reports are received from the state coordinator at the site(s), the grid coordinates of the outbreak(s) are e-mailed (same or following day) to NOAA's Air Resources Laboratory (ARL) in Silver Spring, Maryland. Under cooperative agreement with ARL, spore transport in the atmosphere is then calculated from each site using the HY-SPLIT trajectory model (Figure 6) (12). For the necessary meteorological input, HY-SPLIT commonly uses outputs of either the ETA model of the AVN (Aviation) model, members of the family of Numerical Weather Prediction (NWP) models used to forecast short-term weather conditions in and around the United States. This meteorological data is generated initially by National Center for Environmental Prediction (NCEP), a branch of NOAA, then modified by ARL to conform to HY-SPLIT's input requirements. The data of primary interest are the forecast wind fields in the atmospheric boundary layer. In most cases, HY-SPLIT trajectory maps are returned to the Center from ARL within minutes via an automated Electronic Mail system. The trajectory represents a plot of the future atmospheric center line pathway of a "parcel" of air likely to contain spores; in other words, the forecast contains a prediction of the spatial and temporal positions of a moving spore cloud center, projected two days into the future following release from the source site (7,8).
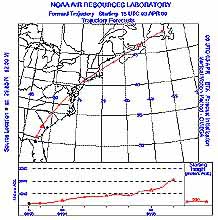
A source site is represented by a geographic point (noted by a colored or black dot or by an asterisk '*' symbol) on the forecast trajectory map. Time-labeled dashes or triangles on the pathway represent the center line of the spore cloud position at six-hour intervals. Chronological time is given in Universal time (UTC - formerly known as Greenwich Mean Time; subtract 4 hours to get Eastern Daylight Time). Header labels detail the time and date of the trajectory start. The latitude and longitude of the disease site used for the source is provided along the left margin of the map.
The small, rectangular graph beneath the plan map indicates the vertical motion (altitude) of the spore cloud center (over 48 hours). This vertical motion is determined using the vertical velocity output of the ETA or AVN model (from NCEP). The solid line represents the pathway, with the dashes on the solid line corresponding to the time marks on the horizontal trajectory shown on the map.
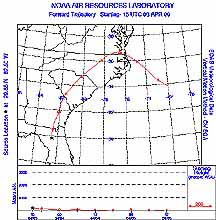
Figure 7 shows a typical forward projected trajectory for wind transport assumed to contain P. tabacina spores from Florida to North Carolina between April 3 and April 5, 2000. For comparison, an archived trajectory (calculated following the actual event) is shown in Figure 8. The two trajectories are very similar for the first 36 hours, but diverge somewhat during the later portion of the event.
 |
|
 |
|
Fig. 7. Typical forward projected trajectory for wind transport assumed to contain P. tabacina sporangiospores (click image for larger view). |
|
Fig. 8. Archived trajectory for wind transport assumed to contain P. tabacina sporangiospores, calculated following the actual event (click image for larger view). |
Potential for Epidemic Spread
A forecaster/meteorologist manages the day-to-day operations of issuing forecasts. Following careful analysis of the weather associated with each source and its respective forecast pathway, a climatology is developed around each trajectory. A disease forecast is formulated and issued (posted) on the NAPDFC Internet Homepage. All daily forecasts and past source locations are archived in a database at the homepage. A Current Forecast section provides a general description and includes access to maps of the latest sources and trajectories available. A Trajectory Weather section describes the recent past, present, and near future weather conditions at the source and along the anticipated pathway. Mentioned here are factors important to sporulation at the source (temperature, rainfall, cloud cover), survivability during transport (cloud cover -- related to UV radiation and desiccation effects), and deposition from rainout and washout (potential rainfall). General weather conditions in the Southeast potentially influencing the movement of spores or providing opportunities for subsequent infection are discussed in a Regional Weather section. An Outlook section combines the relevant biological and meteorological elements describing the likelihood of inoculum spread and disease risk 48 hours into the future.
Given an estimate of source strength, the HY-SPLIT model can calculate 3-D atmospheric concentrations and estimate ground deposition. NOAA/ARL has recently made this option available over the Internet. Click on Figure 9 for a 12 panel dynamic view of the April 3-5, 2000 transport event. Click on Figure 10 for the corresponding ground deposition pattern describing the same case study. It is largely the deposition patterns that relate most directly to the outbreak of mildew diseases 7-14 days following transport.
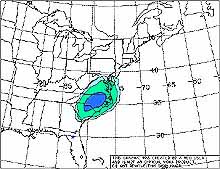
Fig. 9. Twelve-panel dynamic view of April 3-5, 2000 transport event assumed to contain P. tabacina sporangiospores (air concentrations) (click image for viewing options). |
|
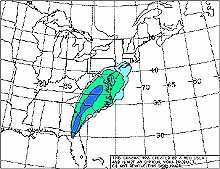
Fig. 10. Twelve-panel dynamic view of April 3-5, 2000 transport event assumed to contain P. tabacina sporangiospores (ground concentrations) (click image for viewing options). |
The Forecast Center is also testing another three-dimensional model for use in the disease forecasts. This is the MASS model.
Evaluation of Source Strength and Disease Risk
Each daily forecast is assigned one or more risk levels, i.e. the chance of initiating spatially distant disease outbreaks in healthy crops. Threat refers to disease development factors at or very near the source including sporangia sporulation. Threat is related to local weather conditions, disease severity, and infected area which influence the source strength (level of spore production). It is an estimate (high, medium, low) of the potential inoculum available for aerial transport to other growing areas. For details on our approach to estimating spore production, view our page on source strength calculation. Risk refers to both development near the source and potential for spread, together with the potential for deposition and infection along the forecast trajectory. Risk focuses on the potential for new disease outbreaks at distant growing areas along the course of a trajectory (or trajectories, as in the case of multiple sources).
|
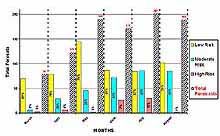
Fig. 11. Frequency of low, moderate, and high risk assessments of tobacco blue mold for Y2000 (click image for larger view). |
|
The Center subjectively relates the three levels of source Threat to five Risk levels (Table 2). The association shares a boundary between Threat and Risk, but there is NOT a strict one-to-one relationship between categories of Threat and Risk. The forecasts are formulated to be as objective as possible with the meteorological tools available. A degree of human experience and subjectivity will always be present in the forecast system until more disease/weather algorithms become available. Quality of disease site observations, confidence in the national weather forecast data, and forecaster experience are all important factors. It's reasonable to assume that different Forecasters, given the same set of weather forecasts, may produce slightly different risk assessments for a given event.
Table 2. Disease threat and risk associations used to evaluate potential spread of downy mildew diseases caused by P. tabacina and P. cubensis.
| Source Threat |
Associated Risk |
| Serious |
High |
| Moderate |
Strongly Moderate |
| Moderate |
| Low |
Weakly Moderate |
| Low |
Supplemental data on the disease sources are sought and frequently obtained from research pathologists and other cooperating experts in Mexico, Latin American countries, Cuba, and Canada.
Archived Forecasts and Yearly Summaries
Tobacco blue mold forecasts since 1996 have been archived under the Center's homepage section called Historical Forecasts. Table 3 shows the number of blue mold forecasts compiled by year and grouped into three risk levels by percentage. The variation in risk level depends upon the temperature, rainfall and other variables from year-to-year. Narrative Season Summaries describe the progress of the epidemic each year, providing a detailed season chronology. Information is provided on first outbreak dates by state (tables), suggested source(s) for each new outbreak, and weather scenarios affecting the rate of continental spread.
Table 3. Summary of blue mold forecasts and risk assessment, 1997-2000.
| Year |
Sourcesa |
Forecast
Days |
Risk
Assess-
mentsb |
Risk level (%) |
Predicted
First
Occurrences |
| high |
moderate |
low |
| 1997 |
25 |
75 |
469 |
15 |
15 |
70 |
12 of 13 |
| 1998 |
24 |
72 |
457 |
15 |
25 |
60 |
13 of 16c |
| 1999 |
19 |
79 |
1,413 |
4 |
21 |
75 |
14 of 14 |
| 2000 |
17 |
79 |
949 |
7 |
35 |
58 |
9 of 13 |
a Sources are the sum of all seasonal sources, i.e., early sources are dropped and new sourced added as the forecasting season progresses.
b Risk assessment is based upon present and future forecast days (2-3) x sources x 1-3 area risk categories per transport event (trajectory).
c Successful prediction of first blue mold occurrences based upon confirmation of an outbreak by the state coordinator 7-14 days following the transport event. For example, in 1998 NAPDFC successfully predicted the disease outbreak in 13 of 16 states reporting blue mold; Kentucky and Tennessee outbreaks were attributed to importing infected transplants while the source of Missouri blue mold remains undetermined.
Decision Support System
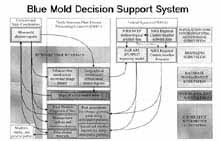
Fig. 12. Diagram showing components of the DSS (click image for larger view). |
|
Farmers, State Coordinators, NAPDFC scientists, NOAA/ARL personnel are all important components of this continent-wide plant disease Decision Support System (DSS) for tobacco blue mold (Fig. 12). Isard and Gage (15) suggest that the NAPDFC system represents a model for IPM users involved with continent-wide pest movement. Growers and State Coordinators continually monitor fields for blue mold during the season and report site, incidence, and source information to the NAPDFC. Using the Center's forecast output as a tool, they also implement the management options available. NOAA assists by collecting environmental data and providing daily weather data for the entire nation. The NAPDFC files and maintains a comprehensive database of each outbreak. It sends daily site parameters to the ARL for the trajectory model runs. NAPDFC forecasters interpret the trajectory paths and weather forecast information, and assess the disease risk(s) to distant, target production areas. The results are disseminated via the Internet homepage to the growers, industry, and the general public. An internal e-mail network of the State Coordinators and closely allied agencies allows the Center to immediately inform all components of the DSS of the background details of new sources and future forecasts on a daily basis. A feedback loop of reported outbreaks and probable sources over time allows for validation of the forecasts. Table 3 shows the successful state first reports based upon the forecasted report. The on-line Decision Support System to date has greatly increased the participation, coordination and efficiency of the disease reporting and field management process. In addition, regional collection of inoculum of the blue mold pathogen for DNA analysis has been facilitated by the system (29).
Long Distance Diagnosis
County extension personnel, growers and the public can access the homepage and view an image library of disease symptoms for both tobacco blue mold and cucurbit downy mildew. If they are not sure of the diagnosis, they are encouraged to transmit electronic digital-camera images of the afflicted plants directly to the NAPDFC, or the North Carolina Plant Disease Diagnostic Clinic, for same-day professional diagnosis. Turn-around time for making control recommendations is very short for a disease that spreads long-distance so rapidly. Educational tutorials are available on the homepage describing the life history of P. tabacina and P. cubensis, detection methods, and epidemiology information of the mildew diseases. A description of the aerobiological movement processes of spore transport in the atmosphere is included. The homepage also includes maps of U.S. county blue mold and cucurbit mildew outbreaks.
Summary
Fast moving, continent-wide disease epidemics require coordinated management approaches based upon readily available and timely information. The NAPDFC at N.C. State University has offered a forecasting/decision system on the Internet to control tobacco blue mold since 1996 and cucurbit downy mildew since 1998. The same general approach is now being applied to transport of allergenic pollens (30).
The Blue Mold Forecast Center at North Carolina State University became operational in March 1996 assuming that role from the University of Kentucky in 1995 (10). During the 1996 season, 345 forecasts were posted on the new Internet homepage on 66 separate days from March 5 to August 8. By 2000, 743 risk forecasts were posted and more than 300,000 visits were made to the Center homepage. Adequate validation of the forecasts is a difficult issue and is presently being addressed. Grower awareness and use of the system has increased significantly over the five seasons. The demand for more and better forecasts is strong. Following 1997, the name was changed to the North American Plant Disease Forecast Center when cucurbit downy mildew forecasting was added and the Center's responsibilities increased. The NAPDFC homepage has become a tool for classroom teaching and post-season analytical studies on epidemic dynamics. The historical and educational tutorial features prove helpful to extension scientists in educating growers as well as classroom teachers. IPM specialists may want to consider the Forecasting Center at N.C. State University as a practical, workable model of decision making for control of other agricultural pests. The Forecasting/Decision System should prove to be a very useful product in the continuing battle against the formerly "unpredictable" downy mildew diseases in the U.S.
Resources for Further Information
Tobacco Blue Mold Forecasting System
Cucurbit Downy Mildew Forecasts from NAPDFC
Physical Aerobiology (Online Journal)
Aerobiologia (Online Journal)
Laboratoire d' Aerobiologie (Universite de Montreal, Canada)
International Association for Aerobiology
Alliance for Aerobiology Research (AFAR)
North Central Regional Committee on Migration and Dispersal of Insects and Other Biotic Agents (NCR-148)
NCR-148 Movement and Dispersal of Biota
Pan-American Aerobiology Association
PAAA Aerobiology 2001 Conference
Intellicast
Unisys Weather
UM Weather
American Phytopathological Society
Related Books from APS Press:
Emerging Technologies for Integrated Pest Management
Blue Mold of Tobacco
Compendium of Cucurbit Diseases
Compendium of Tobacco Diseases
References
1. Aylor, D. E. 1986. A framework for examining inter-regional aerial transport of fungal spores. Agricultural and Forest Meteorology, 38:263-288.
2. Aylor, D. E., and Taylor, G. S. 1983. Escape of Peronospora tabacina spores from a field of diseased tobacco plants. Phytopathology 73:525-529.
3. Campbell, C. L. 1999. The importance of dispersal mechanisms in the epidemiology of Phytophthora blights and downy mildews on crop plants. Ecosystem Health 5:146-157.
4. Campbell, C. L., and Madden, L. V. 1990. Introduction to plant disease epidemiology. Wiley & Sons, New York.
5. Davis, J. M., and Main, C. E. 1984. A regional analysis of the meteorological aspects of the spread and development of blue mold on tobacco. Boundary-Layer Meteorology 28:271-304.
6. Davis, J. M., and Main, C. E. 1989. The aerobiology of the sporangiospore of Peronospora tabacina. Pages 264-267 in: Proceedings 18th Conference Agr. and Forestry Meteorology, American Meteorological Society, March 7-10, 1989. Charleston, S.C.
7. Davis, J. M., and Main, C. E. 1986. Applying atmospheric trajectory analysis to problems in epidemiology. Plant Disease 70:490-497.
8. Davis, J. M., and Monahan, J. F. 1991. Climatology of air parcel trajectories related to the atmospheric transport of Peronospora tabacina. Plant Disease 75:706-711.
9. Davis, J. M., Eisner, A. D., Wiener, R. W., and Main, C. E. 1997. A flow visualization study of spore release using a wind tunnel-mounted laser light sheet. Plant Disease 81:1057-1065.
10. Davis, J. M., Main, C. E., and Nesmith, W. C. 1990. The aerobiological aspects of the occurrence of blue mold in Kentucky in 1985. Pages 55-71 in: C. E. Main and H. W. Spurr, Jr., eds. Blue Mold Disease of Tobacco. Delmar Printing, Charlotte, NC.
11. Davis, J. M., Main, C. E., and Nesmith, W. C. 1985. The biometeorology of blue mold of tobacco. Part II: The evidence for long-range sporangiospore transport. Pages 473-498 in: D. R. McKenzie, et al., eds. Movement and Dispersal of Agriculturally Important Biotic Agents. Claitor's Publishing Co., Baton Rouge, LA.
12. Draxler, R. R. 1992. Hybrid Single-Particle Lagrangian Integrated Trajectories (HY-SPLIT): version 3.0 - User's guide and model description. NOAA Technical Memo. ERL ARL-195.
13. Holmes, G. J. 1999. Forecasting the occurrence and spread of Cucurbit Downy Mildew. April 2001. Published on-line at: http:www.ces.ncsu.edu/pp/depts/cucurbit
14. Holmes, G.J. 1999. Predicting Downy Mildew. American Vegetable Grower. May, 1999.
15. Isard, S. A., and Gage, S. H. 2001. A decision support system for managing the blue mold disease of tobacco: A case study.Pages 143-162 in: Flow of Life in the Atmosphere: An Airscape Approach to Understanding Invasive Organisms. Michigan State University Press, East Lansing, MI.
16. Ledez, P. 1990. The CORESTA tobacco blue mold warning service for the Euro-Mediterranean zone. Pages 79-91 in: C. E. Main and H. W. Spurr, Jr., eds. Blue Mold Disease of Tobacco, Proceedings of a Symposium Held at Raleigh, NC. February 14-17, 1988.
17. Lemke, D. E., and Main, C. E. 1990. Distribution of Nicotiana repanda and Peronospora tabacina in Southern and Central Texas: A potential source of inoculum. Pages 178-182 in: C. E. Main and H. W. Spurr, Jr., eds. Blue Mold Disease of Tobacco. Delmar Company, Charlotte, NC.
18. Lucas, G. B. 1975. Diseases of tobacco, 3rd ed. Harold E. Parker & Sons, Fuquay-Varina, NC.
19. Lucas, G. B. 1980. The war against blue mold. Science, 210:147-153.
20. Main, C. E. 1977. Crop destruction - The raison d' être of plant pathology. Pages 55-78 in: Plant disease, An Advanced Treatise. Vol I. How Disease is Managed. J. G. Horsfall and E. B. Cowling, eds. Academic Press, Inc., New York.
21. Main, C. E. 1991. Blue mold. Pages 5-9 in: Foliar Diseases Caused by Fungi: Compendium of Tobacco Diseases. American Phytopathological Society, St. Paul.
22. Main, C. E., and Davis, J. M. 1989 Epidemiolgy and biometeorology of tobacco blue mold. Pages 201-215 in: Blue Mold of Tobacco. W. E. McKean, ed. American Phytopathological Society, St. Paul, MN.
23. Main, C. E., and Gurtz, S. K. 1989. 1988 Estimates of crop losses in North Carolina due to plant diseases and nematodes. Dept. of Plant Path. Special Pub. No. 8, NC State Univ., Raleigh, NC.
24. Main, C. E., and Keever, Z. T. 1999. Forecasting transport of spores and transport of tobacco blue mold. June 24, 1999. Published on-line at: http://www.ces.ncsu.edu/depts/pp/bluemold/.
25. Main, C. E., and Spurr, H. W., Jr. 1990. Blue Mold disease of tobacco. Proc. Internatl. Symposium on Blue Mold of Tobacco, Raleigh, NC, February 14-17, 1988. Delmar Publishing Co., Charlotte, NC.
26. Main, C. E., Davis, J. M., and Moss, M. A. 1985. The biometeorology of blue mold of tobacco. Part I: A case study in the epidemiology of the disease. Pages 453-471 in: Movement and Dispersal of Agriculturally Important Biotic Agents. D. R. McKenzie, et al., eds. Claitor's Publishing Co., Baton Rouge, LA.
27. Moss, M. A., and Main, C. E. 1988. The effect of temperature on sporulation and viability of isolates of Peronospora tabacina collected in the United States. Phytopathology 78:110-114
28. Nesmith, W. C., and Jones, R. K. 1984. The downy mildew of Nicotiana repanda, a pathogen of burley tobacco (abstr.) Phytopathology 74:631.
29. Ristaino, J. B., and Johnson, A. M. 2000. PCR technology for the identification of the tobacco blue mold pathogen Peronospora tabacina and other pathogens that infect tobacco. Information Bulletin 2000, Coresta Conference. Abstract page 71.
30. Rogers, C.A., and Levetin, E. 1998. Evidence of long-distance transport of mountain cedar pollen into Tulsa, Oklahoma. Int. J. Biometeorol. 42:65-72.
31. Schiltz, P. 1981. Downy mildew of tobacco. Pages 31-45 in: The Downy Mildews. D. M. Spenser, ed. Academic Press, Inc.; New York.
32. Thomas, C. E. 1996. Downy mildew. Pages 25-27 in: Fungal diseases of aerial parts. Compendium of Cucurbit Diseases. A. Zitter, D. L. Hopkins and C. E. Thomas, eds. American Phytopathological Society, St. Paul.
33. Weltzien, H. C. 1981. Geographical distribution of downy mildews. Pages 31-43 in: The Downy Mildews. D. M. Spenser, ed. Academic Press, Inc., New York.
34. Yao, Chengwei, Arya, S. P., Davis, J. M., and Main, C. E. 1997. A numerical model of the transport and diffusion of Peronospora tabacina spores in the evolving atmospheric boundary layer. Atmospheric Environment 31:1709-1714.
Forecasts are prepared by the Department of Plant Pathology and the Department of Marine, Earth and Atmospheric Sciences at North Carolina State University, Raleigh, NC. For a further description of the system, contact C. E. Main, Department of Plant Pathology, Box 7616, North Carolina State University, Raleigh, NC 27695; e-mail: ce_main@ncsu.edu; Tel. 919.515.6992; Fax 919.515.7716.
Research Papers using of the HYSPLIT4 results in a publication requires the following acknowledgement:
HYSPLIT4 (HYbrid Single-Particle Lagrangian Integrated Trajectory) Model, 1997.
Web address: http:www.arl.noaa.gov/ready/hysplit4.html, NOAA Air Resources Laboratory, Silver Spring MD.
The authors wish to acknowledge the many county agents and State Extension Specialists who contribute to the Forecasting Center. We are especially in debt to Dr. Tom Melton and Dr. Paul Shoemaker, North Carolina State University for their advice and support of the forecasting system. Also to be recognized are Josh McIntyre for the typing of the manuscript and Kurt Gegenhuber, APSnet Assistant Editor, for his patience and expertise in handling the interactive graphics.