Many models have been developed for forecasting the probability of infection for particular plant diseases, but there is also the need for generic models that can be applied when new and little-studied pathogens are introduced. Magarey et al. (2005) developed a generic infection model based on temperature and wetness duration. The model is generic in the sense that it was developed to describe any pathosystem when appropriate parameters are supplied.
The principle behind this model is what Magarey et al. (2005) defined as the Critical Disease Threshold (CDT): 20% disease incidence or 5% disease severity under conditions of non-limiting inoculum concentration. Furthermore, the model incorporates a measure for the Wetness Duration Requirement (WDR) function, denoted as W(T), which is the number of hours to reach the CDT at a temperature T. Upper and lower bounds of W(T) are fixed at Wmax and Wmin, respectively. Other parameters in the model are Tmin, Topt and Tmax, which denote the minimum, optimum and maximum temperature (°C) for infection, respectively.
Magarey et al. (2005) used the following model for predicting the probability of infection based on temperature (Yin et al. 1995):

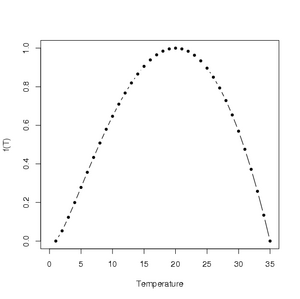
This model is based on the Beta function, commonly used as a probability function in statistics to describe skewed distributions, and was originally introduced to describe the effect of temperature on the rate of crop development (Yin et al. 1995). Since it describes a probability, it has values between 0 and 1. So, f(T) = 0 at T = Tmin and T = Tmax and f(T) = 1 at T = Topt. The Beta function is flexible enough to describe many curves, namely, exponential, positive linear, parabolic and negative responses across a range of temperatures (Garrett et al. 2007).
Using the parameter values from Table 2 in Magarey et al. (2005), an illustration of the temperature response function for Venturia inaequalis, causal agent of apple scab, can be generated in R using the following code:
fT <- function(Tmin,Topt,Tmax,Wmin,Wmax){
  T = seq(0,35,1)
  fT = (Tmax-T)/(Tmax-Topt)*
      ((T-Tmin)/(Topt-Tmin))^((Topt-Tmin)/(Tmax-Topt))
  new.fT = ifelse(fT<0, 0, fT)
  WT = Wmin/new.fT
  new.WT = ifelse(WT<Wmax, WT, Wmax)
  output=plot(T, new.fT, type='b', pch=20, lty=1, col='black',
              xlab='Temperature',
              ylab='f(T) = Probability of Infection')
  return(output)
}
fT(1,20,35,6,40.5)
The resulting graph looks like

Click to enlarge.
The complete generic infection model takes into account f(T) and wetness duration and is defined as:

Magarey et al. (2005) estimated the values of the five parameters Wmin, Wmax, Tmin, Topt and Tmax from published literature or best estimates based on current knowledge of pathosystems. Daily or hourly temperature data were used and T was the daily (or hourly) mean temperature.
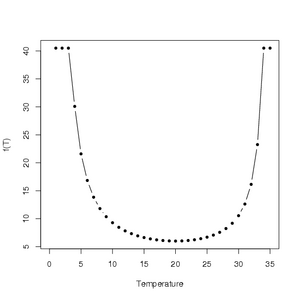
Using the parameter values in Table 2 of Magarey et al. (2005), an illustration of the generic infection model for Venturia inaequalis can be generated in R using the following code:
fT <- function(Tmin,Topt,Tmax,Wmin,Wmax){
  T = seq(0,35,1)
  fT = (Tmax-T)/(Tmax-Topt)*
      ((T-Tmin)/(Topt-Tmin))^((Topt-Tmin)/(Tmax-Topt))
  new.fT = ifelse(fT<0, 0, fT)
  WT = Wmin/new.fT
  new.WT = ifelse(WT<Wmax, WT, Wmax)
  output = plot(T, new.WT, type='b', pch=20, lty=1, col='black',
                xlab='Temperature',
                ylab='f(T)')
  return(output)
}
fT(1,20,35,6,40.5)
With the resulting plot

Click to enlarge.
Suggested Exercise
Compare different risk curves for the following pathosystems and corresponding temperature and wetness data. You will need to set up a vector of this information to use with the two functions. Also, using plotting techniques described throughout the ecology and epidemiology in R series, try plotting different curves together to compare responses for different pathosystems to a range of environments.
|
Pathosystem |
Tmin |
Topt |
Tmax |
Wmin |
Wmax |
|
Colletotrichum acutatum/strawberry |
7 |
27.5 |
35 |
6 |
36 |
|
Septoria glycines/soybean |
10 |
25 |
35 |
6 |
18 |
|
Botrytis cinerea/grape |
10 |
20 |
35 |
4 |
10 |
Due to differences among pathogens or their hosts, additional methods for calculations and disease assessments were used, some of which are listed below:
-
Daily vs. Hourly Measures
For hourly temperature data, a new critical value, the critical dry-period interruption value (D50) was defined to be the duration of a dry period at relative humidities < 95% that will result in a 50% reduction in disease compared to a continuous wetness period. On the basis of this, the following assumption was made in relation to wet periods W1 and W2 separated by a dry period D:
Wsum = W1 + W2 if D<D50 and W1, W2 if D>D50
-
Humidity vs. Moisture
Analogous to the critical disease threshold (CDT), a relative humidity threshold was defined for pathogens that require high relative humidity rather than free moisture. The wetness duration requirement (WDR) was defined to be the number of hours above a relative humidity threshold.
-
Wmin
For the CDT of Ascochyta rabiei, a severity value of 25% was used since the slope of the response at 5% was zero. Wmin was set to be the point of inflection of the disease intensity curve where ratings or lesion counts were used for disease assessments whereas it was set to be the category corresponding to light where severe or light designations were used.
-
Tmin and Tmax
Tmin was estimated from the host’s development threshold if there was no apparent lower limit for infection. It was set to be 5° C lower than the lowest tested temperature if infection occurred below the host’s development threshold. Tmax was set at 35° C if there was no upper temperature limit on infection.
The authors have compared original observations and model predictions for 52 different pathogens using Pearson’s correlation coefficient (r) and Root Mean Square (RMS). In order to take into account the influence of Wmin in RMS, they have also used Standardized Root Means Square (SRMS) = RMS/Wmin. The average and median values of r were found to be 0.83 and 0.94 respectively. Likewise, mean values of RMS and SRMS were 4.8h and 0.6 respectively.
This model is useful because it does not require extensive amounts of biological data. It can incorporate subjective estimates of Tmin, Topt, Tmax, Wmin and Wmax, which can be obtained from published literature for many pathosystems. Moreover, all five parameters have a clear biological meaning (Yan and Hunt 1999). Another good point is that it uses the temperature response approach, which is widely applicable. However, the model does not include the interaction between temperature and wetness, so will be less useful for pathosystems for which this interaction is important. The validation provided by the authors also testifies to its successful prediction in most cases. The model can certainly be adapted to exotic pathogens because of its generic nature and is being used by the USDA Animal Plant Health Inspection Service for several applications (R.D. Magarey, personal communication).
Next, Development and evaluation of a disease prediction model
